


In today’s connected world customers demand greater reliability; this necessitates easy access to information about an asset’s status; even assets like transformers that are not traditionally monitored → 1,2. To tackle this challenge, several monitoring methods have been developed to detect imminent problems experienced by power transformers and other devices in a power network. Currently, ABB offers a wide range of such asset monitoring systems [1].

Nonetheless shortcomings exist: the installion of modern monitoring systems requires specialized equipment and diverse proprietary software. Also, monitoring usually relies on condition assessment models based on data obtained from specialized sensors for gas in oil, temperature, dielectric losses, partial discharges, among others.
Furthermore, because the failure rate of power transformers is about one percent per year [2–4], most transformers are monitored manually by taking periodic offline measurements. The infrequency of these measurements heavily restricts the ability of the operators to react quickly to faults, or to correlate a reading to a system event.
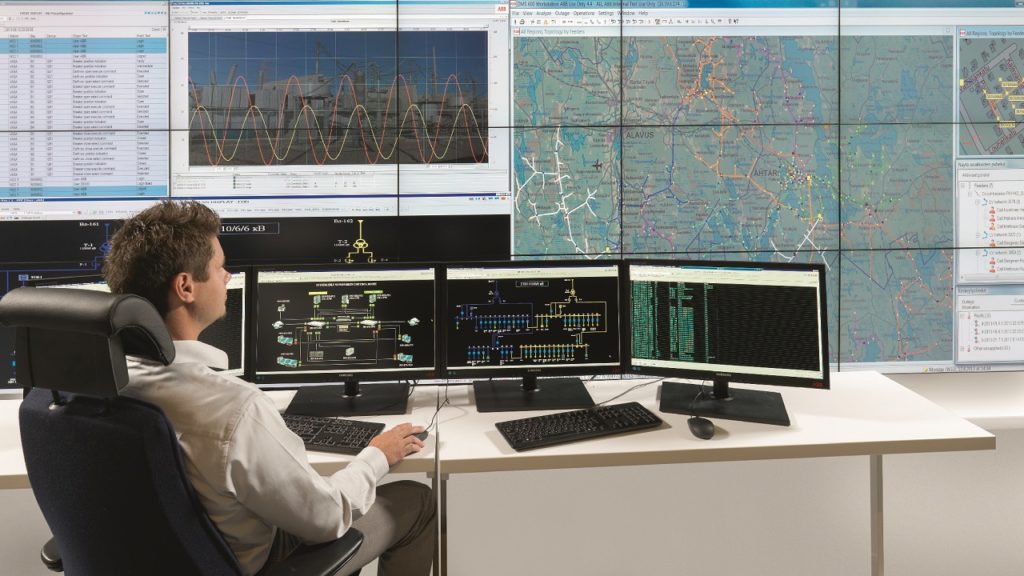
Performance monitoring
Realizing these limitations, ABB’s experts evaluated whether standard substation equipment could be used for monitoring while a transformer is in service, thereby complementing current online monitoring systems. The advantages of such functionality would be consequential:
• There would be no need for specialized equipment; or, any additional hardware installations, ordinarily.
• The substation SCADA system could be used for data analysis, presentation, alerts and logging. By fully integrating the system with all other substation functionalities, communication to higher level systems would be achieved.
The extracted information would not only be relevant for a large number of known fault scenarios, one could also evaluate how well the monitored asset performs its duty – performance monitoring.
___
ABB developed two unique monitoring applications that are integrated into MicroSCADA Pro.
Based on this, ABB has developed two unique monitoring applications: a power transformer performance monitor and a tap changer operation monitor. Both monitors are integrated into ABB’s MicroSCADA Pro using this infrastructure for communication, presentation and alerts. To deliver the required measurements, substation modifications are limited to installation of monitoring applications and configuration of protection relays.
Monitoring transformer performance
The power transformer performance monitor analyzes all voltages and currents in and out of a transformer to derive estimates of its turns ratio, short-circuit impedance and power loss [5–7]. These values can be directly compared to values on the name plate and from factory acceptance tests. Thus, the results are easy to interpret and the estimated sensitivity to changes are in accordance with the required precision of offline tests [8,9]. ABB’s monitoring system allows several important transformer issues to be detected with great sensitivity, eg, shorted turns, deformed windings and eddy currents. By measuring the power loss online, operators receive a much faster indication of any change in transformer conditions than temperature can deliver. Such monitoring can reduce the frequency of traditional offline tests.
Moreover, new measurements are compared to historical measurements. Thus, sudden changes in the transformer performance, even miniscule changes, can be detected. Following a system incident such as a fault, performance can be compared before and after the incident. Furthermore, power system conditions that affect transformer performance, such as reverse power flow from renewable generation, can also be ascertained.
Model-based monitoring
The performance monitor samples steady-state waveforms of voltages and currents in and out of the transformer at a regular interval, typically a few times per hour. Initially, the observed voltages and currents are used to set the parameters of a simple transformer model, the contribution from magnetization, Rm and Xm, can be separated from the winding impedances by using measurements made under varying load conditions; thus, all model parameters are determined →3.
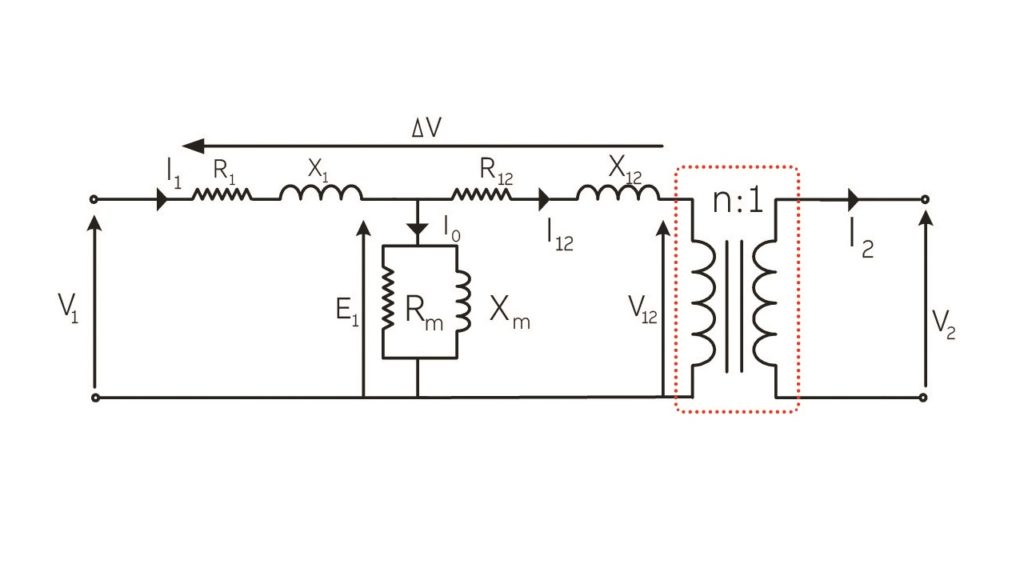
With the model parameters set, the monitor continuously delivers new estimates to detect any possible change. Every new measurement is compared to model predictions: This allows sudden performance changes to be recognized as fast as the measurement rate allows.
Nevertheless, limited accuracy is a challenge: voltage and current transformers are accurate within a range of one percent; the power loss of a modern transformer is typically less. ABB’s extensive field tests show that individual instrument transformers are more sensitive to change than the accuracy rating implies (at least an order of magnitude better).
The performance monitor also delivers regular estimates of transformer ratio, impedance and magnetizing current; and evaluates both the power loss and deviations from model predictions for every new measurement.
Monitoring tap operation
The on-load tap changers are the only transformer parts that utilize mechanical movement and therefore account for approximately one-third of transformer failures [2–4].
Consequently, many methods have been explored to monitor tap changers [10–12]. These methods are dependent on the use of additional sensors for vibration or motor current and do not, therefore, provide a clear estimate of the commutation time – a crucial additional performance indicator.
ABB’s tap changer operation monitor analyzes the transformer internal loss during a tap change with the same voltage and current signals as does the performance monitor. This novel monitor provides an estimate of the commutation time and the extra power loss associated with commutation.
___
The novel tap changer operation monitor analyzes the transformer internal loss during a tap change.
A transition time that is too brief indicates a risk for an arc that bridges the tap contacts; a transition time that is too long indicates mechanical problems. ABB’s investigation shows that changes in the commutation power loss are due to the transition resistors: the expected power loss can be determined from the tap changers’ name plate.
Tap operation monitor function
A tap changer does not simply shift to another number of turns in the transformer, it shifts the turns ratio in successive steps to avoid excessive arcing and other potential dangers. A circulating current between the old and the new tap positions is driven by the voltage difference and limited by the transition resistors.
The circulating current causes a temporary additional loss that can be extracted through a careful signal analysis →4. The commutation time and the resistor value can be estimated from the duration and magnitude of the additional loss.
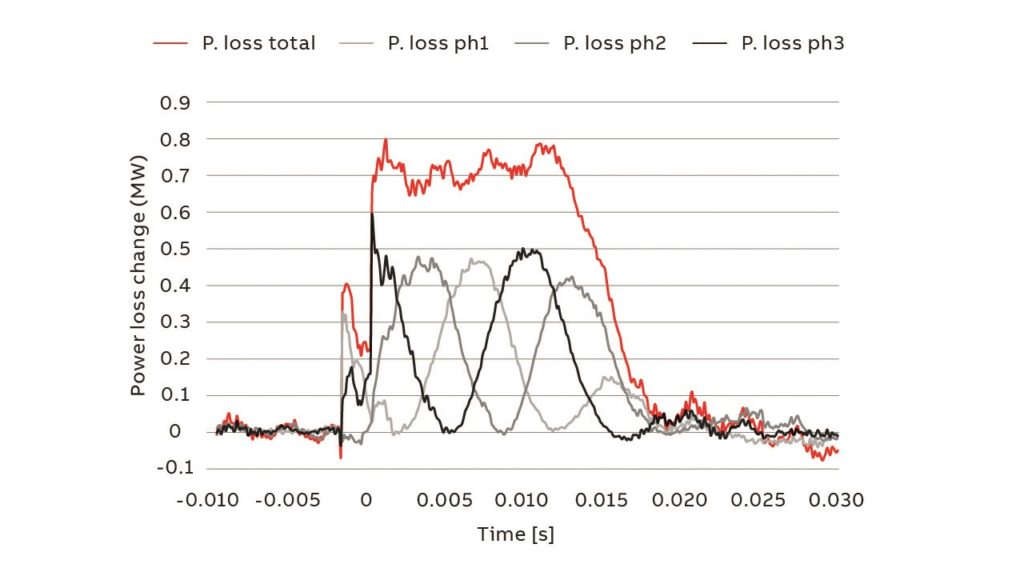
Tap operation monitoring analyzes waveforms recorded during a tap change for the tap-change additional power loss. Such records are readily obtained from an adequately configured disturbance recorder.
Transformer performance case studies
Field cases exemplify just how sensitively transformer performance can be monitored with ABB’s revolutionary monitoring solutions. Deviations from the model can unveil information about the occurrence and timing of an event, and more importantly, the cause.
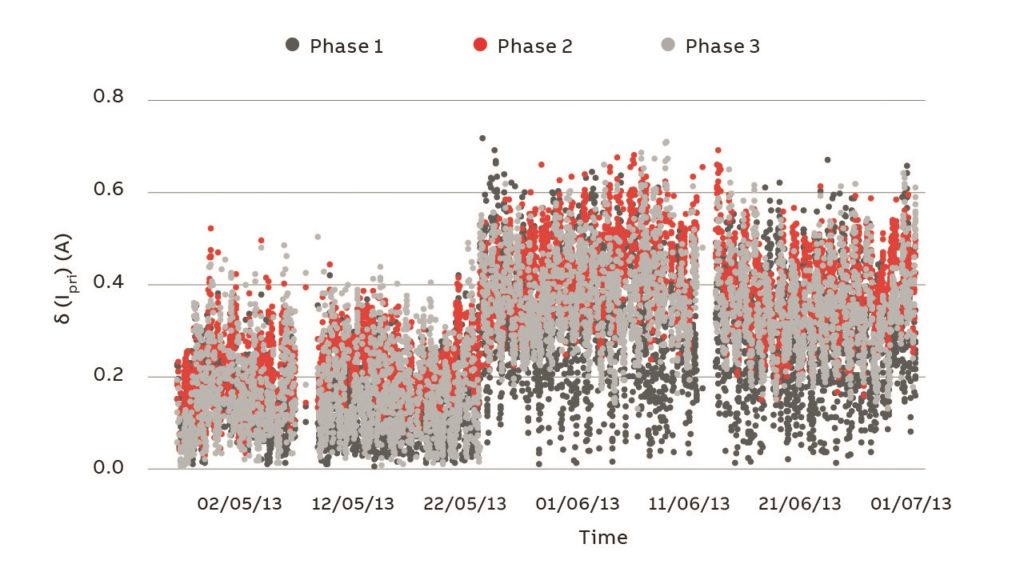
Permanent change due to saturation In one case ABB evaluated a transformer incident that occurred on May 22, when the current deviation from the established model changed abruptly →5. Because this change is not dependent on the load, it was attributed to the presence of a magnetizing current. The timing of change correlated with energization of a transformer located nearby. The associated voltage effect is postulated to have driven the transformer to saturation; this created permanent eddy current paths in the structural parts. Nonetheless, the transformer remained in service because the increase in power loss was relatively low, about 20 percent of the losses at no load.
Temporary high loss due to external conditions
Because power system conditions, external to the transformer, can also affect performance, ABB evaluated power loss in a real-world field study.
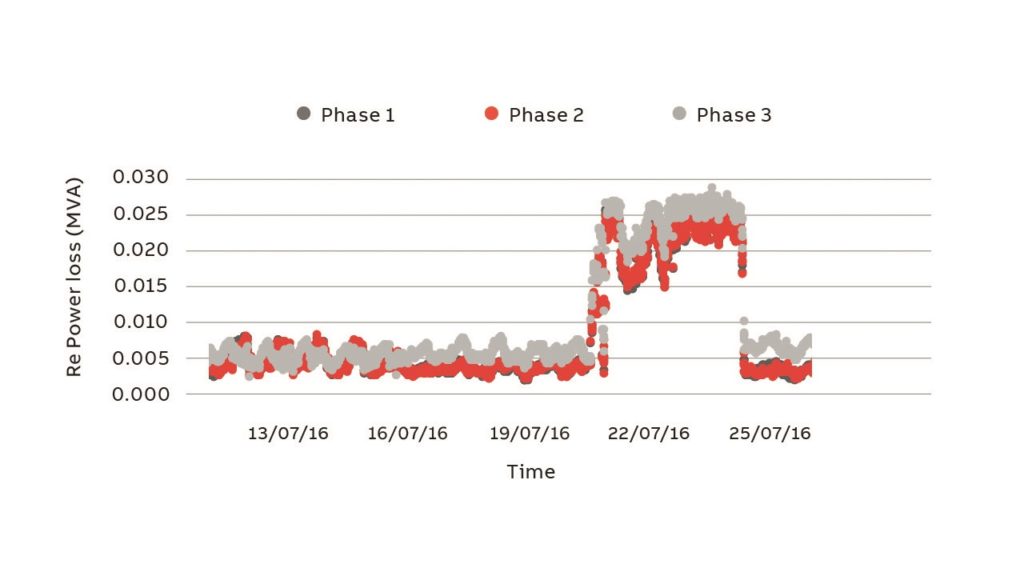
The studied 50 MVA transformer had a history of generating thermal alarms due to elevated temperature. An abnormal power loss was registered precisely by the performance monitor →6. There was no permanent change in transformer properties because the observed increase in power loss was temporary. On several past occasions, increased power loss was also observed and was correlated to operation at a small hydro-power station, located at the secondary side. ABB’s novel monitoring system established the timing and likely cause of the event. Findings such as this corroborate the need for monitoring renewable power production.
Commutation time variation
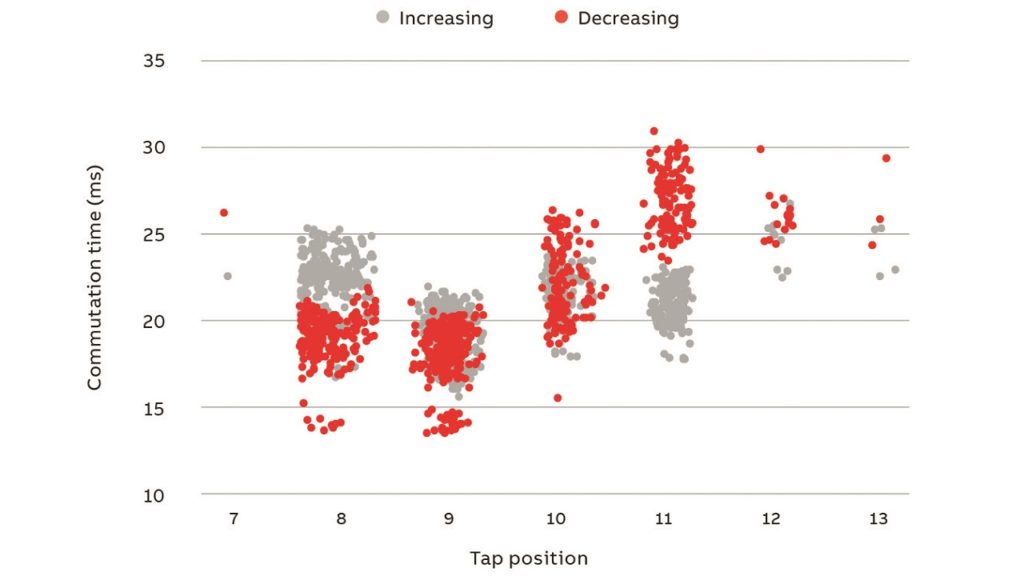
For some tap changer designs, the commutation time may vary between positions. To illustrate this, ABB estimated commutation time for a few thousand operations of one tap changer in service →7. The observed time differences between taps are significant and indicate contact wear has occurred and this tap changer should be scheduled for maintenance.
MicroSCADA Pro implementation
A Supervisory Control and Data Acquisition (SCADA) environment is ideal for the presentation of monitoring results because most other aspects of substation operation, such as event handling and cyber security are readily available.
A properly configured protection IED serves as an acquisition unit; the disturbance records are made available by IEC 61850-8-1. Preprocessed results are then sent to the SCADA application process objects in ABB’s MicroSCADA Pro terminology.
___
ABB’s MicroSCADA Pro is ideal for the presentation of results because other aspects of substation operation are readily available.
The use of standard IEDs for basic signal acquisition eliminates not only the need for dedicated acquisition hardware, it also enables the use of either conventional (110V/5A) or digitized signals on the substation process bus for monitoring.
An update of process objects that belong to a specific MicroSCADA Pro function triggers additional analysis and attention indicators, eg, transformer ratio, loss, impedance, current difference, tap operation time and trend. Currently, a few dozen attention indicators are calculated: each is expressed in specific units of an acceptance limit. Thus, an attention indicator value of one means that the monitored quantity is precisely that of the acceptance limit.
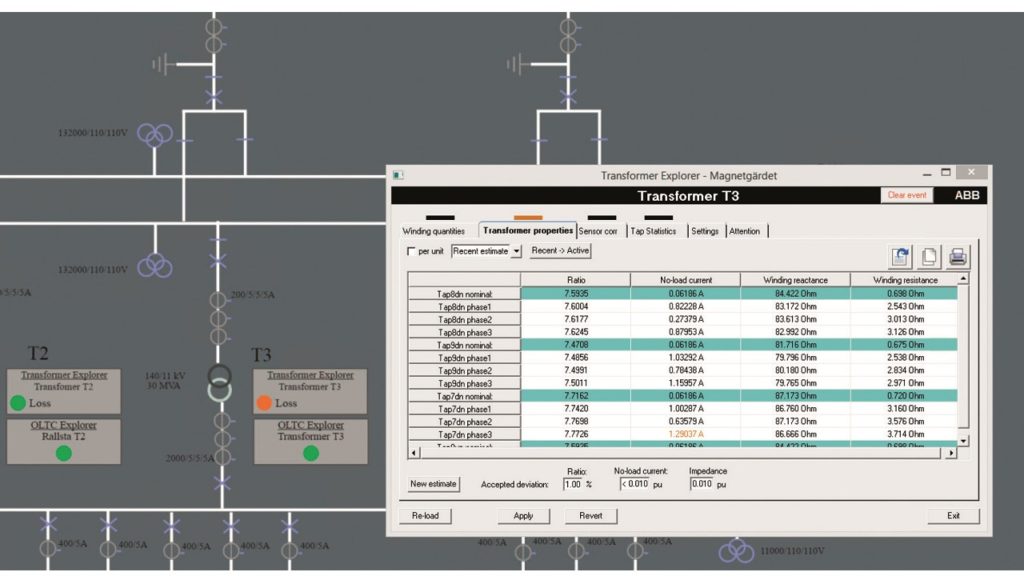
The attention indicators can be summarized as a single main indicator – using the maximum value of all. This indicator is then used to control the appearance of the monitoring symbols →8. Thanks to this notification, the operator can click the symbol for additional information. An attention indicator that exceeds the acceptance limit will trigger a MicroSCADA Pro event – the event log then identifies the indicator and timing. The monitoring dialogs present all recent data and analytical results, eg, the transformer model parameters for each phase and tap positions utilized can be displayed →8.
Thanks to the MicroSCADA Pro application, further processing and logging is facilitated – selected results can be communicated to fleet-level asset management systems. Furthermore, the monitoring applications generate their own logs, which can be sent for detailed analysis to ABB’s remote experts.
Ushering in new monitoring capability
The presented method and results illustrate ABB’s new approach to monitoring: additional monitoring functions are fully integrated into standard substation equipment. The monitors not only serve to detect imminent faults; they also evaluate the assets’ performance in actual service.
To date, ABB has successfully field tested the monitoring applications on eight power transformers ranging from 30 to 1,000 MVA and from 120 to 750 kV. Data gathered from approximately ten transformer years and 10,000 tap operations have been recorded; this data provides rigorous support for ABB’s novel approach.
Intent on bringing customers the best monitoring systems possible today and in the future, ABB continues to explore additional functionalities utilizing a similar structure.
.
Acknowledgements
The authors wish to thank their colleagues from ABB business units for their support and encouragement.
References
[1] ABB product guide, available under: https://new.abb.com/products/transformers/service/advanced-services
[2] CIGRÉ Working Group 05, “An international survey on failures in large power transformers in service,” Electra, no. 88, May 1983.
[3] F. Vahidi, S. Tenbohlen, “Statistical Failure Analysis of European Substation Transformers,” ETG-Fachbericht – Diagnostik elektrischer Betriebsmittel, 2014 pp. 5–9.
[4] M. Minhas, et al., “Failure in power system transformers and appropriate monitoring techniques,” presented at the 11th Int. Symp. High Voltage Engineering, London, U.K., 1999.
[5] T. Bengtsson and N. Abeywickrama, “On-line Monitoring of Power Transformer by Fundamental Frequency Signals”, Cigré 2012, Paper A2-110.
[6] N. Abeywickrama, et al., “Transformer Explorer – monitoring transformer status by fundamental frequency signals”, Condition Monitoring and Diagnostics (CMD) Conference, X’ian, China, Sept. 25–28, 2016, Paper 116.
[7] S. Sahoo, et al., “Monitoring Power Transformer Performance, Usage and System Event Impacts – A Case Study,” 3rd International Conference on Condition Assessment Techniques in Electrical Systems (CATCON), Nov. 2017.
[8] IEEE Guide for diagnostic field testing of electric power apparatus – Part 1: Oil filled power transformers, regulators, and reactors, IEEE Std. pp. 62, Dec. 1995.
[9] Power transformers – Part I: General, IEC 60076-1.
[10] T. Bengtsson, et al., “Acoustic Diagnosis of Tap Changers”, Cigré 1996, Paper 12–101.
[11] R. Jongen, et al., “On-load tap changer diagnosis with dynamic resistance measurements,” IEEE International Conference on Condition Monitoring and Diagnosis, Bali, 23–27 Nov. 2012, pp. 485–488.
[12] K.G. Lewis, et al., “A tap-changer monitoring system incorporating optical sensors,” Second International Conference on the Reliability of Transmission and Distribution Equipment, Coventry, UK, 1995, pp. 97–102.
.
[Authors]
Tord Bengtsson, Nilanga Abeywickrama, Robert Saers, Subrat Sahoo
ABB AB, Corporate Research, Västerås, Sweden,
tord.bengtsson@se.abb.com, nilanga.abeywickrama@se.abb.com, robert.saers@se.abb.com subrat.sahoo@se.abb.com









![[칼럼] IT/OT 융합 환경의 사이버 복원력 확보를 위한 OT 보안 아키텍처 및 AI 위협 탐지 기술 분석](https://icnweb.kr/wp-content/uploads/2023/02/rockwell-automation-mobileAna_900.jpg "[칼럼] IT/OT 융합 환경의 사이버 복원력 확보를 위한 OT 보안 아키텍처 및 AI 위협 탐지 기술 분석")











![[이슈] 스마트 공장 통신 표준 완성… IEC/IEEE 60802 TSN 통합 표준 발표](https://icnweb.kr/wp-content/uploads/2026/09/TSN_60802_standard_AI-900web.jpg "[이슈] 스마트 공장 통신 표준 완성… IEC/IEEE 60802 TSN 통합 표준 발표")